Patient safety culture toolkit
Our toolkit includes templates and guidance to help hospitals implement the Australian Hospital Survey on Patient Safety (A-HSOPS) 2.0 survey and interpret, discuss and action results.
Quick links
Survey form: Complete a short form to download the A-HSOPS 2.0.
Technical specifications: The specifications are designed to enable consistent collection of the survey, increase response rates and minimise invalid or biased responses.
Templates: The Commission has developed a range of templates to support hospitals implementing the A-HSOPS 2.0. These can be modified to meet hospitals’ needs.
Implementation strategies: AHRQ has compiled a list of practice resources to improve patient safety culture and patient safety in hospitals. While this resource list is not exhaustive, it is designed to give initial guidance to hospitals seeking information about patient safety initiatives.
For question or feedback please contact our indicators team
Continuous effort is required to change and improve culture. Detailed measurement of patient safety culture using tools like A-HSOPS 2.0 is recommended every two to three years. This allows enough time to analyse results, feed it back to staff and take action as well as time for improvement projects to impact on the culture of the organisation.
Organisations should continuously monitor culture in between these more detailed approaches. Progress can be tracked against a range of proxy measures such as staff turnover, absenteeism, patient and staff complaints, improvements in reporting of incidents and annual organisational culture surveys. Qualitative approaches such as focus groups and interviews can also be useful to monitor progress between surveys.
Stage 1: Develop the project rationale and plan
Before starting a patient safety culture project, it is important to take some time to plan out your approach, scope, budget and resources.
Agreeing on these fundamental issues will contribute to the success of the project.
This section will guide you through the steps to plan your project and the outcome of these decisions can be documented in the project plan template.
Considerations before you start
It is important to consider engagement from senior leadership, the resources required to undertake the project and the cultural maturity of the organisation before taking on a safety and quality improvement project.
Is senior leadership engaged?
Buy-in from leadership is critical to the success of these types of projects. Without this support it can be challenging to get staff to complete the survey and even more challenging to get support for initiatives identified through the survey.
Do you have the resources to take action?
Measuring culture without acting on the information collected can be detrimental to culture and can make future work in this area more challenging. There should be sufficient resources to undertake the project in its entirety including feeding back the information and the implementation improvement strategies.
Is the organisation ready?
Insights into the culture of a hospital can be gained from existing information such as exit interviews, retention rates, complaints and error reporting (low levels may indicate an issue). The approach to measurement will depend on the level of cultural maturity. For cultures with very low maturity and a lack of trust, asking staff about their experiences and perspectives through a survey can be ineffective and potentially harmful to the culture. Staff may fear the information will be attributed to them or have a sense that nothing will be improved because of the work. Alternative approaches may need to be considered to improve the culture before it is measured using a standardised tool.
Articulate the purpose, objectives and scope
Before starting the project, it is critical to consider and articulate what you want to achieve.
Consider the project as a complete improvement cycle not just the measurement component of the work. This will help to implement the project in a way that leads to improvement.
The project may have multiple objectives and measurement of patient safety culture can be used to:
- raise staff awareness about patient safety
- identify strengths and areas for improvement to target interventions
- evaluate the cultural impact of patient safety initiatives and interventions.
Other considerations when developing your project are:
- Is the focus of the work on the unit, department, hospital or a group of hospitals?
Culture varies and can be influenced at a unit, department or whole of organisation level. There may be a particular area within the hospital where concerns have been raised – for example through broader organisational surveys, other safety measures or direct feedback. The project can be set up to focus on this area or as a hospital-wide initiative. - Are there specific aspects of patient safety culture that have been identified as an issue?
Insights into the culture of a hospital can be gained from a range of sources such as organisational surveys, exit interviews, retention rates, incident investigations and complaints. These may identify specific areas of focus. Identifying these areas early will inform decisions about which survey to use and if additional questions should be added.
Determine available resources, scope and schedule
Resources
Key to an effective project are a clear budget and a realistic schedule. It is also important to consider your available resources at an early stage, not only to administer the survey but also to analyse the data, communicate the results, undertake action planning and implement change.
Reflective questions:
- How much funding and/or resources are available to conduct this project?
- How will you engage staff across the organisation?
- Who within the hospital is available to work on this project?
- What is the availability of the project team?
- When do we need to have the results completed and available?
- Are there any aspects that we need external help with?
Scope
The scope of your work will reflect the project objectives and resources. While measuring the culture of the whole hospital is ideal, it is resource intensive to undertake the complete improvement cycle. Measuring culture without acting on the information collected can be detrimental to the culture of a hospital and to any future surveys of staff. Where resources are limited, there may be a need to prioritise work for a specific department or use a sample of staff.
Form a project team and identify champions
Establish a project team responsible for planning and managing the project through to implementation of the action plan.
Engaging people from across the hospital will support shared ownership of the work and engagement in the outcomes. Identifying the project team and key stakeholders is important regardless of whether you conduct the survey in-house or in partnership with an external vendor.
Engaging this team early and sharing the workload of the project will help to encourage high participation rates and engagement in the process.
The team will include specific roles with one person needing to take on multiple roles.
| Role | Description and time commitment |
|---|---|
| Hospital coordinator | Usually from the quality improvement team. Responsible for coordinating the administration of the survey. This should be a full time staff member. Approx. 3 - 6 weeks for survey plus long term commitment for implementation of actions. |
| Senior executive sponsor | A senior hospital executive who will drive the project, support feedback to the leadership group and ensure the project is used to improve quality and safety. Approx. 3 days for survey plus long term commitment for implementation of actions. |
| Senior clinical lead | Senior clinician who will drive the project and support feedback to clinical staff. Approx. 3 days for survey plus long term commitment for implementation of actions. |
| Human resources contact | A contact in HR who will support the collation of the list of emails and the collection of complementary HR measures such as absenteeism, turnover and complaints. Approximately 2 days. |
| IT contact | A contact in the IT department to support testing of the survey, address any IT issues with sending out bulk emails and accessing online survey collection platforms. Approx. 2 days. |
| Analyst | Undertake the analysis and presentation of the data. Approx. 1-2 weeks. |
Project champions/ Points of contact | Identify other clinical and non-clinical staff who can champion the work and encourage participation in the project. You may decide to recruit a champion for each hospital unit/work area or staff position included in your sample. Unit-level champions typically are at the management or supervisory level, such as nurse managers, department managers, or shift supervisors. Approx. 1 day. |
Decide on the data collection method
Online surveys
We recommend surveys of patient safety culture are administered online as this offers advantages including:
- there are no surveys or cover letters to print, survey packets to assemble, postage or mailing envelopes to arrange, or completed paper surveys to manage
- the responses are automatically entered into a dataset, so separate data entry is not needed
- the task of data cleaning is reduced by validation checks built into the online survey.
Increasing access and response rates
Providing access to complete the online survey at the hospital will help increase your response rates and ensure that the project is inclusive of all staff.
Options for this include:
- dedicated computer booths where staff can complete the survey
- access to tablets with the survey
- one-off events to promote the project where there are laptops/tablets available to complete the survey.
Combine with paper-based surveys
Some hospitals may choose to use paper surveys to support data collection for a small number of hard-to-reach staff. Where paper surveys are used, they should be marked in the dataset.
Combining online and paper surveys (a multi-modal approach) can be used to capitalise on the advantages of online surveys, while increasing response rates in hard-to-reach groups. However, this approach can add a level of complexity to data collection, calculating response rates and reporting.
The results from paper-based and online surveys will need to be independently checked and validated before both sets of data are consolidated.
Decide whether the survey will be confidential or anonymous
The survey can either be confidential or anonymous. When making the decision consider your hospitals privacy policy, how previous surveys have been conducted and the level of trust.
A confidential survey is one where the survey administrators can link survey responses to individuals, but assurances and processes are in place to ensure that identifiable data will not be released to anyone.
An anonymous survey is one where no identifiers are used to link survey responses to individuals.
| Confidential - unique link | Anonymous - generic link |
|---|---|
Pros:
| Pros:
|
Cons:
| Cons:
|
Decide whether to use an external vendor
You may consider using an outside vendor for all or selected aspects of the project. For example, you might choose to administer and send out the survey internally but use an outside vendor for data analysis and reporting.
If you engage an external vendor:
- provide a written outline of the work requirements. Make tasks, expectations, deadlines, and deliverables clear and specific. Include information on the requirements of the survey platform, data storage and reporting requirements
- ensure you stipulate that the data remain the property of the hospital and what will be done with the data at the end of the project – including your expectations for the provision of the raw data file and deletion of the data by the vendor.
If your organisation is implementing a survey across multiple hospitals, try to hire one vendor for all hospitals.
This will lead to consistent data collection methods and make comparison easier and there are likely to be economies of scale.
Finalise the project plan and schedule
Careful planning of the timing of the project will ensure it runs smoothly without undue stress on the project team. Consider the timing of the project carefully. Consider the other events in the hospitals calendar such as public holidays, other staff surveys and accreditation. A draft timeline is provided in the project plan template. This timeline is provided as a guide only and should be updated taking into consideration your project team’s resources.
In planning the project, it is useful to assign these tasks to members of the team or an external vendor:
- Planning and budgeting - determine the scope of the project given the available resources, plan project tasks, and monitor the budget
- Establishing contact people - assign points of contact to support survey administration, maintain open communication throughout the project, and provide assistance
- Preparing publicity materials - create flyers, posters, email and intranet messages to announce and promote the survey in the hospital, plan when these will occur
- Programming the web survey instrument - design the instrument, program the survey, and pre-test the instrument
- Distributing and promoting the survey - distribute email invitations and reminder emails over the data collection period. Actively promote the survey and provide access for staff to complete the survey while at work
- Calculating preliminary response rates - monitor survey returns and calculate preliminary response rates
- Handling data cleaning, analysis, and report preparation - review survey data for errors in electronic data files, conduct data analysis, and prepare reports of the results
- Distributing and discussing feedback results with staff - disseminate results broadly to increase their usefulness, target feedback to meet stakeholder needs
- Developing action plans - investigate and understand the results to develop a plan for improvement. This may require additional information from interviews, focus groups or observation
- Monitoring the implementation of the interventions and feedback on the action - keep staff and executive informed on the progress of the interventions.
- Additional tasks for paper surveys include:
- Preparing paper survey materials - Print surveys, prepare postage-paid return envelopes and labels and assemble these components for survey distribution
- Distributing and receiving paper survey materials - Distribute surveys and reminder notices and handle receipt of completed surveys
- Data entry and cleaning - Enter paper surveys, conducting spot checks and combining the datasets from paper based and electronic collections.
Stage 2: Running the survey
At this stage you have decided to undertake an improvement project using a survey of patient safety culture, engaged champions and developed a clear project plan. Stage 2 steps you through preparing for and running the survey.
The examples used here relate to the use of the Australian Hospital Survey on Patient Safety Culture 2.0 (A-HSOPS 2.0), however this information can be adapted to support the implementation of any survey in a hospital setting. Additional detail is provided in our technical specifications for the A-HSOPS 2.0.
Determine who to survey
Including the perspective of all hospital staff provides the most complete picture of the culture of the hospital. A-HSOPS 2.0 can be completed by all types of hospital staff - from housekeeping and security to nurses and hospital administrators.
The project team should also consider the level of cultural maturity and the readiness for change. Undertaking a survey of patient safety culture in a unit, department or hospital already identified as having very low levels of trust, accountability and other negative cultures needs to be done with care. Other strategies may need to be implemented first to understand the culture and build trust before conducting a survey of patient safety culture.
Census or sample?
The survey can be administered to all staff (a census), a proportion of all staff (a representative sample), or focus on specific units or staff positions (a targeted sample).
Census
A census approach has the following advantages and, where resources are available, is the preferred option for most hospitals as it:
- conveys a message of inclusiveness by giving all staff the opportunity to provide feedback
- results in data that are more representative of your hospital’s workforce
- allows for more detailed analysis and reporting of results at a unit and department level
- makes communication about the project easier.
Targeted sample
A patient safety culture measurement project may be focused on specific groups within the hospital. This may be due to resource constraints or to examine an issue that has been identified through other means. You could focus on:
- all staff from several units/work areas/ departments
- all staff within specific positions or levels of experience
- a combination of the above.
This approach should never involve purposeful selection of individuals from within these groups.
A targeted approach can have the following challenges that will need to be managed through careful communication and engagement:
- concerns about why the focus is on a particular group
- clarity about who is included in the sample.
Additional care also needs to be taken to ensure that the data is reported in a way that protects the confidentiality of respondents, our technical specifications for the A-HSOPS 2.0.
Representative sample
Using a representative sample is a way of decreasing the resources required to measure patient safety culture which can be useful in large hospitals.
You can expect to receive completed surveys from about 30 to 50 percent of the sample. The table below shows the recommended minimum sample sizes using a 50 percent response rate. You should update the estimated response rate based on your previous experiences with staff surveys to calculate your sample. The more staff surveyed, the more likely you are to have a representative sample.
| Number of staff | Recommended sample size | Number of surveys to send out (based on 50% response rate) |
|---|---|---|
| 500 (or fewer) | 250 (or fewer) | 500 - a census of all staff |
| 501-699 | 250 | 500 |
| 700-1,299 | 300 | 600 |
| 1,300-3,999 | 350 | 700 |
| 4,000 or more | 375 | 750 |
It is important to use a method that ensures the sample is representative – staff should never be purposefully selected to complete the survey. Options for sampling include:
- Simple random sampling: involves selecting staff randomly so that each staff member has an equal chance of being selected
- Systematic sampling: involves selecting every Nth person from a staff list. To begin, sort your staff list by unit/work area and then by staff position. If you have a list of 1,200 names and need to select 600 to include in your sample, you begin at a random point on the list and then select every other name on your list. Thus, if you begin with the first person on the list, you select the 2nd, 4th, 6th, 8th, etc., staff member, compiling a total of 600 names in your sample.
Compile the staff list
Work with your HR team to compile a list of staff. Including the following information will allow you to remove duplicates, send out the survey and track response rates by key demographics:
- first and last name
- email address
- hospital unit/work area
- staff position or job title.
Once you compile your list, review it to make sure the information is complete, up to date, and accurate. Make the following corrections where possible:
- remove names of staff who appear on the list more than once
- exclude staff who no longer work at the hospital
- exclude staff who only work in outpatient setting, not in the hospital inpatient setting.
If you are conducting a census of all staff, no sampling is needed; your list is complete. If you are conducting a sampling approach you should now select the sample.
Engage project champions and senior executive
Key to successful implementation of the project is engagement with the board, senior executive and project champions. Take time to engage with these stakeholders early and make sure you have buy-in. These champions are particularly important in large hospitals where it is harder for the project coordinator to walk the floors and engage with staff. A range of resources have been developed to support communication and engagement.
Senior leadership
In addition to designating a senior executive sponsor as a part of the core project team, broader senior executive engagement is critical. Demonstrating commitment sends a powerful message to staff that the survey is being taken seriously and that providing feedback is valued by the organisation. This will improve staff attitudes towards the survey, result in higher survey response rates and build trust that action will be taken in response to the findings.
Actions senior leadership can take to show their commitment to the improvement project include:
- allocate sufficient resources including time for staff to complete the survey during work hours
- publicly endorse and promote the survey, via all-staff briefings, emails and memos, newsletters and intranet communication
- direct managers to support staff participation by discussing it and facilitating time to complete it
- tell staff why their participation is important and how results will be used
- thank staff for participating when data collection has finished
- ensure ongoing communication with staff through the action planning and improvement stages of the project.
Project champions
Achieving buy-in from managers and clinical leaders at all levels is also important in ensuring engagement from staff. Communication should be early and ongoing. You will need to communicate the following to achieve buy-in:
- why the hospital is considering conducting the survey
- what will be measured
- how the findings will be fed back to staff
- how the findings will be used for improvement.
Response rates from medical staff are often lower than other hospital staff. Engaging senior medical leadership from the beginning of the process can help. Targeted communication should focus on ways in which the project will benefit medical staff to encourage their participation in the process.
Customise the survey
The survey was developed to be general enough for use in most hospitals. We recommend making only those changes to the survey that are absolutely necessary.
Our A-HSOPS 2.0 technical specification outlines the changes that can be made to the survey. In short, changes to the survey should be limited to:
- changes to the unit/work area and position questions to ensure that the structure reflects the hospitals structure and analysis requirements
- the addition of a small number of questions at the end of the core survey questions
- the addition of a small number of demographic questions to allow for more detailed analysis.
The updated survey should be tested with staff; the total time to complete the survey should not exceed 15 minutes.
Further guidance is provided in our technical specifications for the A-HSOPS 2.0.
Design and test the survey
The survey should be entered into the online platform at least two weeks before the planned release date to allow time for user testing.
The importance of user testing should not be underestimated – if staff are unable to access the survey on their first attempt, they are unlikely to try to access it again. Testing is particularly important if an external vendor will send the invitations. You may need to work with your IT team to make sure emails from the vendor are not blocked.
You should test that:
- all questions are entered correctly
- the layout is user friendly on a small laptop computer and mobile phone
- the unit/work area and position response options make sense to your hospital staff
- the survey platform is accessible on hospital computers (not blocked)
- the survey platform allows multiple responses using the same IP address
- the survey invitations go to staff members inboxes (not flagged as junk)
- the IT system can handle bulk emails to all staff (if not, you may need to send batches)
- the data file exported from the survey platform displays as expected (no skipped questions or out of range values).
Some hospitals will have the capability to pre-fill some demographic information by connecting the survey to their HR systems. This approach should only be used by hospitals where there is sufficient trust from staff that they will not be identified and that their confidentiality will be maintained.
Our A-HSOPS 2.0 technical specification provides information on how this can be done.
Develop communication materials
It is useful to develop your communication materials ahead of time. We have communication templates which can be modified to meet hospitals' needs.
The templates include:
- posters
- flyers
- frequently asked questions
- draft communication from management
- draft invitations to complete the survey.
These templates will be added to overtime and you can reach out to us about any additional materials you would like developed and shared.
Maximise response rates
A range of approaches to encourage involvement in the survey have been identified through the pilot process. It is not necessary to use all of these approaches. Hospitals should choose approaches that meet their needs and suit their context.
Approaches to maximising response rates include:
- walking the floors to encourage participation and answer questions about the project
- ensuring it is clearly communicated that staff can complete the survey during work hours and providing dedicated times to do so
- advertising the survey on the intranet
- attaching the link and QR code to shared computers so the survey can be completed at an opportune time
- updating the promotional materials with photos of actual hospital staff
- regularly changing promotional material throughout the data collection period to maintain interest
- customised communication for different staff cohorts explaining why it is important for them and their work
- presenting information on the project at multiple forums – such as all staff forum, team briefings
- connecting the project with another initiative or day – such as international patient safety day
- hosting afternoon teas where computers or tablets are available to complete the survey
- encouraging competition between units/ departments on response rates
- provide daily or live updates on the rate of completion at a unit/ work area level
- providing specific times and spaces where staff can complete the survey
- offering a prize or reward for participation at an individual or unit level.
Send pre-notification communication (1-2 weeks before release)
The email or letter should describe the objectives of the project and the instructions for completing the survey.
This should be on official letterhead/email and be sent 1-2 weeks before the survey is released.
Other pre-survey promotion may include:
- an email from senior leadership showing support for the project
- posters highlighting the survey is coming soon
- communication about the project through other forums such as newsletters and the intranet.
Distribute survey (release)
The survey link should be sent in an email early on the day of the survey. Ensure that the systems have been thoroughly tested prior to the release of the survey
On-the-day promotion of the survey may include:
- An event – for example linking to an awareness day
- An afternoon tea and presentation on the project
- Access to a staff member who can answer questions about the project.
Track responses and encourage participation (Weeks 1-4)
Response rates should be tracked throughout the survey period. Many online platforms will have options to track responses automatically.
It is useful to have a HR listing of staff members eligible for participation broken down by unit/work area to monitor response rates and target follow-up. This information is also valuable for assessing the representativeness of the survey sample.
Weekly reminder emails should be sent to encourage participation. Some platforms will allow you to target reminders to people who have not yet completed the survey. An option to unsubscribe from reminders should be included.
Thank staff and overview next steps (Week 4)
It is key that the contribution of staff is acknowledged, and they are informed of the next steps of the project. This is an easy step to overlook as you move on to the work of analysing the results, but it is important to take a moment to thank staff for participating and the project team for their support. This is also an opportunity to assure staff that action will be taken because of their efforts.
Stage 3: Analysis and reporting
This section steps through the process of analysis and reporting survey data on patient safety culture. The examples used here relate to the Australian Hospital Survey on Patient Safety Culture 2.0 (A-HSOPS 2.0), however this information can be used to support the implementation of any survey of hospital staff and should be read alongside our A-HSOPS 2.0 technical specification.
Develop an analysis and reporting plan
There are a broad range of ways to use the data collected through the A-HSOPS 2.0. An analysis plan will help ensure the analysis is efficient and meets the project’s requirements. Considerations include:
- Timely feedback is critical: Keep the initial analysis manageable so feedback can be provided in a timely way – this will keep staff and leadership engaged in the process
- Stage the analysis: It is not necessary to undertake all of the analysis at once. Initial findings can be used to begin the consultation process and seek input on additional analysis requirements (example provided below)
- Customised reports: Key stakeholders include the board, quality committees, management and staff. Customise your reports for each of these audiences, from one- or two-page executive summaries to more complete reports that use statistics to draw conclusions or make comparisons
- Resources: Analysis of the data takes time and requires expertise. It may be necessary to engage an external vendor to help with this component of the work. It is best to engage an external vendor early in the project
- Minimum numbers:To protect confidentiality of respondents ensure that there are at least five respondents for any group that is reported on.
Options for analysis
Data can be analysed at a hospital, department or unit level and a range of statistics can be generated. More detailed analysis can explore the data by the demographics collected in the survey.
| Scoring methods | Level of measurement | Demographics |
|---|---|---|
|
|
|
Staff who work at the hospital for a short period of time may have a different perception of the culture.
The project team may consider analysing the following groups separately based on the objectives of the project:
- staff who have not been at the hospital/unit very long (i.e. less than 6 months)
- locums
- students/ trainees and registrars.
Recommended staging of the analysis
| Stage 1 | Hospital level analysis: This will provide an overall view of the hospital’s culture and can be quickly disseminated to stakeholders. If resources allow, include a high-level summary of the key themes identified in the comments. |
|---|---|
| Stage 2 | Analysis for each unit/department: Culture varies within hospitals. Providing data at a unit/department level is critical to understanding the specific culture of that area and engaging staff in the findings. Results should only be reported where at least five staff have completed the survey; results may need to be aggregated up to a higher level for small hospitals. |
| Stage 3 | More detailed analysis includes:
|
Create the data file
Each row in the data file should represent the responses of one staff member and each column should represent a different survey item. The original data should be stored as a .csv file as this format can be imported and exported from most programs.
The A-HSOPS 2.0 technical specification sets out the data labels that should be used for each of the items in the survey. Storing the data in-line with the technical specification will ensure that future staff can easily understand the contents of the data file and supports comparison overtime within, or between, services.
Data collected through an online platform can be exported into a data management program, such as Excel or SPSS. Any paper surveys will need to be entered manually. The responses should be entered carefully into the correct column and spot checks should be performed by another team member to ensure accuracy. Questions requiring written responses (i.e., ‘Section G: Other, please specify’; ‘Section H: Your comments’) should be entered verbatim (as written by the respondent).
Add hospital level data
The A-HSOPS 2.0 technical specification provides advice on what information on the administration of the survey should be included in the data file. These data include the timing of the data collection, number of staff at the hospital and sampling method.
Data management
Several data files will be created during the analysis process. It is important to maintain the original data file created when the survey responses were entered. Additional files should be carefully labelled for version control. Retaining the original file allows you to:
- correct possible errors made during data cleaning or recoding processes
- go back and determine what changes were made to the data set and conduct other analyses.
Ensure that all the data files are stored securely on a protected drive. The data files should only be accessible to members of the project team who undertake the analysis.
Clean and code the data
All survey response options are assigned a numeric value, including ‘does not apply’ and don’t know’. Most responses will be coded from 1 to 5 (or 9 for Does not apply/Don’t know). For demographic and background questions, codes have been assigned for each of the response options. These are detailed in our A-HSOPS 2.0 technical specification.
The A-HSOPS 2.0 includes some negatively worded items. Negative items are items where the response scale differs in direction from most other items. In this survey, negatively worded items are the ones where a favourable response is ‘Strongly disagree’ and ‘Disagree’ or ‘Never’ and ‘Rarely' (e.g., ‘In this unit, staff feel like their mistakes are held against them'). Negatively worded items need to be recoded prior to analysis. Our A-HSOPS 2.0 technical specification provides information on which items are negatively worded and coding of these items.
Check and clean the data
It is important to check to see if the data contains errors. If you are using a statistical analysis program, such as SPSS, start by producing frequencies of responses for each item looking for out-of-range values or values that are not valid responses. If using Excel, you can apply a filter and check each question for out-of-range responses, or the data validation feature can be applied.
Calculate response rates
Response rates are an important indication of the generalisability of results to the entire hospital. Higher response rates increase trust that the results are a representation of staff views. Response rates should be reported alongside any survey data.
Ineligible surveys are those that are:
- completely blank
- contain ‘Does not apply/Don’t know’ for all survey items
- contain the exact same answer to all the items in the survey
- contain responses to less than 6 of the 26 survey rating items (i.e. surveys less than 20% complete).
These responses should be removed from the analysis.
To calculate the response rate, divide the number of eligible surveys returned by the number of eligible staff who were sent the survey. For example, if there are 500 staff were sent the survey, and you receive 125 responses, your response rate is 25% (125/500).
Item level scoring
Dealing with skipped question and 'Does not apply/Don’t know' responses
While the ‘Does not apply’/’Don’t know’ response option will limit the amount of missing data, there are still likely to be some instances where respondents answer most questions but skip a question or two. Exclude the ‘Does not apply’/’Don’t know’ and missing responses when calculating your responses to the survey items.
Depending on your audience you may wish to display the number or proportion of ‘Does not apply’/’Don’t know’ and missing data as additional information under your figures or include this in a separate table at the end of a more detailed report.
Frequencies
One of the simplest ways to analyse the results is to calculate the frequency of responses for each survey item. This means reporting the number or percentage of respondents who selected each response for each survey item.
Percent positive
The most common way to score the A-HSOPS 2.0 is to calculate the percentage of positive scores for each survey item. This provides a single number to interpret for the end user, increasing the way data can be presented. Information on calculating percent positive score for positively and negatively worded items is provided below.
For positively worded items - percent positive scores are the combined percentage of respondents who answered ‘Strongly agree’ or ‘Agree’ or ‘Always’ or ‘Most of the time’.
'My supervisor / manager seriously considers staff suggestions for improving patient safety'
| Response | Number of responses | Response percentage | Combined percentages |
|---|---|---|---|
| 1 = Strong disagree | 10 | 20% | 40% negative |
| 2 = Disagree | 20 | 20% | |
| 3 = Neither agree nor disagree | 10 | 10% | 10% neutral |
| 4 = Agree | 40 | 30% | 50% positive |
| 5 = Strongly agree | 20 | 20% | |
| Total | 100 | 100% | 100% |
| 9 = Does not apply/Don’t know | 10 | - | - |
| Blank = Missing (did not answer | 5 | - | - |
| Total number of responses | 115 | - | - |
For negatively worded items - percent positive scores are the combined percentage of respondents who answered ‘Strongly disagree’ or ‘Disagree’, or ‘Never’ or ‘Rarely’, because a negative answer on a negatively worded item indicates a positive response.
‘My supervisor /manager wants us to work faster during busy times, even if it means taking shortcuts.’
| Original response | Recode | Number of responses | Response percentage | Combined percentages |
|---|---|---|---|---|
| 1 = Strong disagree | 5 | 10 | 10% | 20% positive |
| 2 = Disagree | 4 | 10 | 10% | |
| 3 = Neither agree nor disagree | 3 | 10 | 10% | 10% neutral |
| 4 = Agree | 2 | 40 | 40% | 70% negative |
| 5 = Strongly agree | 1 | 30 | 30% | |
| Total | 100 | 100% | 100% | |
| 9 = Does not apply/Don’t know | 10 | - | - | |
| Blank = Missing (did not answer | 10 | - | - | |
| Total number of responses | 120 | - | - |
Composite scoring
The A-HSOPS 2.0 has nine composites (each composed of 2-3 items which measure the same underlying concept). Calculating composite scores is a simple way of providing a high-level overview of the survey findings. The composites and their items are provided in our technical specifications.
- Step 1: Make sure all negatively worded items have been recoded correctly
- Step 2: Calculate the composite percent positive/composite score for each individual response
- Step 3: Average the composite percent positive/composite score by the number of responses included in the analysis.
Example calculation of composite scores for the teamwork composite
| Composite | Item wording | Person 1 | Person 2 | Person 3 |
|---|---|---|---|---|
| Step 1: Recode | In this unit, we work together as an effective team | Agree (4) | Neither agree nor disagree (3) | Agree (4) |
| During busy times, staff in this unit help each other | Strongly agree (5) | Agree (4) | Agree (4) | |
| There is a problem with disrespectful behaviour between staff working in this unit (negatively worded) | Strongly disagree(5) | Agree (2) | Agree (4) | |
| Step 2: Calculate for each person | Individual composite score | (4+5+5)/3= 4.67 | (3+4+2)/3= 3.00 | (4+4+4)/3= 4.00 |
| Individual composite percent positive | 3 out of 3 are positive (3/3)*100= 100.00% | 1 out of 3 positive (1/3)*100= 33.33% | 3 out of 3 positive (3/3)*100= 100.00% | |
| Step 3: Average | Unit level composite score | (4.667+3.000+4.000)/3= 3.89 | ||
| Unit level composite percent positive | (100.00+33.33+100.00)/3= 77.77% |
Note this example uses a unit made up of three people for simplicity. Real responses should not be reported for groups less than five.
Overall scores
An overall safety culture score and overall percent positive score can also be calculated. To calculate the overall safety culture score/ overall percent positive:
- Step 1: Calculate an average score or percent positive for each respondent
- Step 2: Calculate an average for the hospital – sum all responses and divide by the number of respondents.
More detailed analysis
Another way you can analyse the data is by segmenting the results by demographics or work characteristics. For example, examining differences in patient safety culture between clinical and non-clinical staff or investigating differences in patient safety culture depending on years of service at a given hospital.
Using inferential statistics
While descriptive statistics are often sufficient to feedback information to begin a dialogue about quality improvement, inferential statistics can be useful for more detailed analysis.
Inferential statistics are particularly useful for testing hypotheses, such as evaluating a safety initiative your organisation has undertaken. Inferential statistics can be used to track hospital results over time to see if changes are significant. You may also want to make inferences about different units/departments within your hospital or examine the results between several hospitals to drive improvement.
For analysis using inferential statistics, you may need to consider seeking external support – unless there is someone at your hospital who is experienced in this area.
Inferential statistics include:
- T-tests: Determines if there is a significant difference between the means of two groups
- Analysis of Variance (ANOVA): Used to determine whether there are statistically significant differences between the means of two or more independent groups
- Analysis of Covariance (ANCOVA): Similar to the ANOVA, the ANCOVA determines differences between groups while statically controlling for other variables
- Regression analysis: A suite of statistical procedures for examining the relationship between two or more variables of interest.
Analyse the open-ended responses
Open-ended responses provide depth and detail to complement the quantitative survey data – they help to understand the 'why' and 'how' of the rating questions. They can also provide information on topics not covered in the survey and suggestions on new ideas for improvement.
Turning comments into useful information can be resource intensive and it is important to allow time and resources to do this in your analysis plan.
De-identifying responses
Before open ended responses are examined, they should be carefully de-identified to ensure that they do not contain any information that can be used to identify the respondent or individuals referred to in the comments. This includes removing names but also identifying characteristics included in the comments, such as personal characteristics.
Providing direct quotes can be useful, particularly for senior management to get a broad perspective on the culture of their organisation. However, we recommend caution in providing quotes to direct supervisors and managers as these quotes may be identifiable by writing style or content.
Coding and analysis
Open ended responses can be examined using qualitative analysis. Qualitative analysis involves reviewing the data multiple times and coding the themes that emerge.
We recommend a three-step process for analysing open ended responses from the A-HSOPS 2.0:
- Code by composite
- Sub-code
- Analyse and report
You can code the data in Microsoft Excel or use a specific qualitative data analysis software such as NVivo. Qualitative data analysis software is not essential, and many people prefer coding using more manual processes such as pen and paper or an Excel spreadsheet.
Demographic information
Consider which demographic information you want to use in the analysis of the comments before you start coding – such as unit/work area, position or length of service.
You can either keep the demographic information alongside the comments while you code or split the comments up by that demographic before you start coding.
Code by composite
For the first stage of coding, use the survey composites as themes. One or two staff members read through the comments and assign the composites. Some comments may fit under multiple composites. For example, the example comment below can fit under both ‘teamwork’ and ‘communication openness’ composites. In this case, code the comment to each of the composites that it aligns with.
‘I like that at every morning huddle, our PCD [patient care director] asks for any safety stories to share with the team…. Sometimes they are good catches and sometimes they are mistakes, but we feel comfortable sharing and learning how to be better.’
This is known as deductive coding; a top-down approach to coding qualitative data using an existing set of themes (in this case, the nine composite measures of safety culture). Coding by composite will allow these data to be interrogated alongside the quantitative data collected in the survey.
Sub-code
Once you have all the comments grouped together under each composite, read through the comments in each composite individually. Identify recurring themes and assign descriptive codes to each of the sub-themes. You may need to revise these codes as you go by reading over the comments and sub-themes to ensure they fit well.
Analyse and report
Tallying the number of comments per theme is a useful way to identify the most prominent themes. Use illustrative quotes to demonstrate each of the themes (and sub-themes). If you analyse the comments by demographics (e.g., position or length of service), you may wish to include that information alongside the comments (so long as the staff members remain non-identifiable). A good rule of thumb to maintain confidentiality is to only report one demographic per quote.
Theme: Hospital management support for patient safety
| Sub-theme | Example quote |
|---|---|
A desire for hospital management to better understand staff difficulties and patient safety concerns n=5 |
|
Budgetary concerns drive resource scarcity n=7 |
|
Frustration about openness to staff input or timely follow-through from management regarding staff concerns n=12 |
|
Data presentation
There are a range of ways the data can be presented. Irrespective of the format used, a concise summary which is easy to understand without creating cognitive load is absolutely critical for all staff to engage in results and build trust in the process.
Different audiences will have different requirement, interest and time – a number of different reports may be required to reach all stakeholders.
A number of options for data presentation are provided below.
Clustered bar chart (Composites)
This example shows percentage positive results for each composite at two time points. Colour can be useful in highlighting where the results show significant improvements.

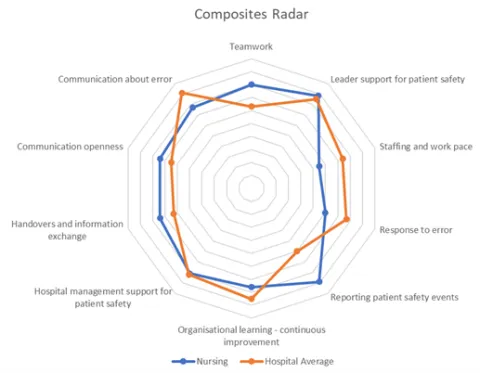
Radar chart (composite level)
Radar charts can be useful to convey all of the composites on one page. Including a comparison with the hospital average or previous score and help with the interpretation of the data.
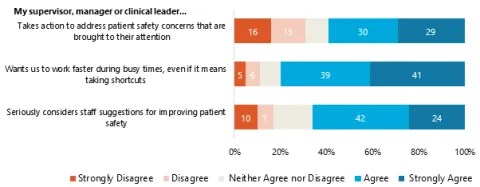
Stacked bar chart (Item-level)
This example shows percentages of agreement for each item within one composite: Supervisor, Manager or Clinical Leader Support for Patient Safety.
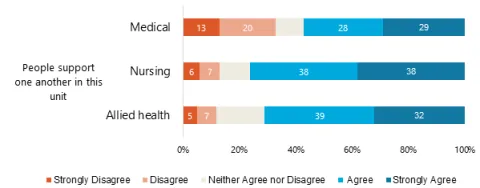
The next example shows percentage of agreement separately for health workers for one item. In this case, the results indicate that medical staff disagreed with this item more than other staff and
may be an area for further investigation.
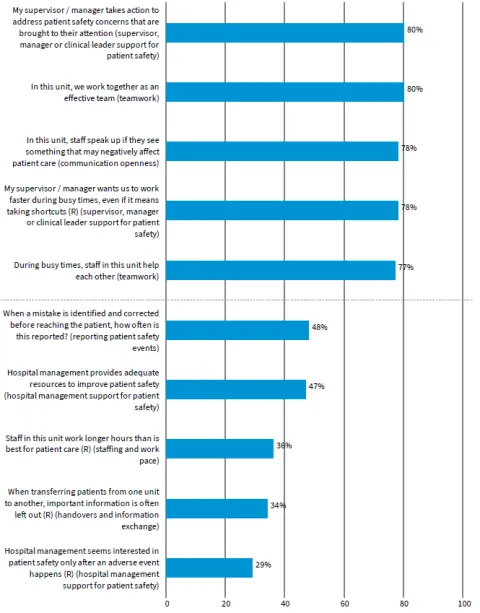
Highs to lows
A simple analysis you can use is to report the percent positives for each survey item and use this to create a list of the five highest and five lowest survey items.
Stage 4: Feedback, action planning and improvement strategies
Using the data collected for quality improvement is the most important part of this work.
This section provides advice on feedback, action planning and improvement strategies. This information can be used to support the use of the data collected through any patient safety culture improvement project.
Feedback at multiple levels
Feedback is key to a patient safety culture project. Ideally, feedback should be provided broadly – to management, administrators, boards of directors, committees, and staff—either directly during meetings or through communication tools such as email, intranet sites, posters, presentations or newsletters. The more broadly the results are disseminated, the more useful the information is and the more likely respondents will feel that taking the survey was worthwhile.
A lack of feedback to staff can have detrimental effects on culture and can impact engagement in future surveys and quality improvement activities.
Increasingly, results can be fed back through electronic tools which allow users to interrogate the data by different demographics in the survey. These can be useful for engaging managers and staff with the data. As with paper reports, any online tools should not report on groups with less than five responses.
Gathering additional information
A survey of patient safety culture should be seen as a starting point for further, targeted, discussions with hospital staff. Interviews, focus groups and direct observation can be used to verify or deepen your understanding of the survey data or find out more about an issue identified in the survey data.
You may also consider triangulation with other data sources already accessible to your hospital. For example:
- other safety and quality measures
- incident reports
- retention rates
- complaints and compliments
- broader organisational culture surveys
- workplace health and safety data
- exit surveys.
Action planning
Developing actions for improvement are a crucial part of conducting a patient safety culture improvement project. For effective action planning you will need leadership support, board engagement and an action planning team. Your action planning team should be multidisciplinary, including at least one senior leader and key stakeholders that will be impacted by any change initiative.
Tips for effective action planning include:
- hold multidisciplinary focus groups with a mix of staff with different roles, expertise, skills and perspectives to develop the action plan
- focus on the shared goal of improving patient safety
- send a summary of the survey findings before the focus group highlighting both areas that need improvement and areas where the hospital is doing well
- focus on a limited number of achievable actions – not all change needs to be drastic, focus on something small and feasible first
- ensure there is engagement with senior leadership and staff throughout the process.
An action plan is an essential part of any quality improvement process. It documents your goals, approach to improvement, who is responsible, what resources are required, your timeline and how you will measure progress.
There are a range of action planning tools available. The Agency for Healthcare Research and Quality (AHRQ) has developed an Action Planning Tool to support use of the survey results from the Hospital Survey on Patient Safety Culture (HSOPS 2.0). It provides step-by-step guidance to help survey users develop an action plan to improve patient safety culture and an action plan template your hospital can use.
Outcomes of the action planning and progress against the plan should be fed back to hospital staff.
Improvement strategies
Based on the results of the survey analysis and action planning process, improvement strategies can be implemented to enhance the patient safety culture at your hospital. Consider what would work in your hospital and engage staff throughout the process.
Improving patient safety culture can be challenging and it can be difficult to know where to start. Small changes can be helpful but, in some cases, larger changes may be required. Additional resources may be required to undertake change programs, including support from external experts or additional internal resources. Long term commitment from senior leadership is important to ensure momentum and resources are maintained.
A range of resources are available on potential improvement strategies:
- AHRQ has compiled a list of practice resources to improve patient safety culture and patient safety in hospitals. While this resource list is not exhaustive, it is designed to give initial guidance to hospitals seeking information about patient safety initiatives. The list is arranged by the composites in the HSOPS 2.0
- The Manchester Patient Safety Framework is a tool to help healthcare organisations reflect on their progress in developing a safety culture. The MaPSaF can be used to evaluate a specific intervention or reflect on the current safety culture to develop suggestions for improvement in a workshop
Continuous improvement
Continuous effort is required to change and improve culture. For this reason, it is important that continuous monitoring is conducted and the action plan is evaluated. Progress can be tracked against a range of measures such as staff turnover, complaints, error reporting and annual organisational culture surveys. Qualitative approaches such as focus groups and interviews can also be useful to monitor progress between surveys.
Formal measurement of patient safety culture is recommended every two to three years. This allows sufficient time for work from the previous improvement projects to impact on the culture of the organisation.
Each time the survey is conducted, the findings must be distributed back to participants. Each report should be compared to previous rounds of data collection, indicating if there has been any improvement in the hospital’s patient safety culture.