GP Guide to Practice Reflections: COPD medicines
This guide will help general practitioners interpret the information in their Practice Reflections report on Chronic Obstructive Pulmonary Disease (COPD) medicines.
What is the GP Guide to Practice Reflections for?
General practitioners across the country were sent a Practice Reflections report on COPD medicines at the beginning of July 2026.
This guide will help general practitioners better understand and contextualise the information in their own Practice Reflections report and support their own quality improvement activities. The report is not an audit, compliance check or nudge letter and is not monitored by the Commission.
If you did not receive a report, you can view a sample report or read our FAQs to find out more about Practice Reflections.
Important information about the data
The reports contain Pharmaceutical Benefits Scheme (PBS) dispensing data for general practitioners’ COPD patients along with aggregate data from general practitioners in similar remoteness areas for comparison purposes. The reports focus on COPD restricted and/or authority required benefit PBS prescriptions.
The Commission’s recent Atlas Focus report showed a 130% increase in dispensing of triple therapy (ICS with LAMA and LABA) nationally between 2015–16 and 2022–23. The MedicineInsight Snapshot report also showed only 30% of COPD patients prescribed triple therapy had a prior dual therapy (LABA and LAMA) prescription.
The risks of ICS outweigh the benefits for most patients with less severe COPD. COPD is typically characterised by neutrophilic airway inflammation, which does not respond as well to ICS as the eosinophilic inflammation typically seen in asthma. ICS also increases pneumonia risk in patients with COPD.
An important element of COPD management is the stepwise approach to pharmacotherapy. The COPD-X stepwise approach involves stepping up (or stepping down) therapy in response to symptoms and exacerbations, and includes:
- checking adherence and inhaler technique before any progression in treatment
- starting with a short-acting inhaled bronchodilator (SABA or SAMA) as needed
- adding a long-acting bronchodilator (LAMA or LABA) if persistent or troublesome dyspnoea (note LAMA should not be combined with SAMA)
- dual therapy with a LABA plus LAMA for patients who remain symptomatic despite using either one alone
- considering the addition of an inhaled corticosteroid (LABA + LAMA + ICS) in patients with ongoing symptoms and at least 1 severe exacerbation requiring hospitalisation, or at least 2 moderate exacerbations, in the previous 12 months.
The comparator group ‘RA’ includes all GPs located in the same remoteness area as your practice (metropolitan, regional or remote). The data is based on prescriptions for COPD restricted and/or authority required benefit on the PBS that you prescribed and were dispensed to patients aged 35 years and over. SABA and SAMA are not included.
N.B. The peer comparison is included to provide context for reflection. Please note that there is no single ‘right’ number, as your patient population and clinical circumstances are unique.
Data
Figure 3 - Percentage of patients aged 35 years and over by type of COPD treatment dispensed and were prescribed by you in 2025†
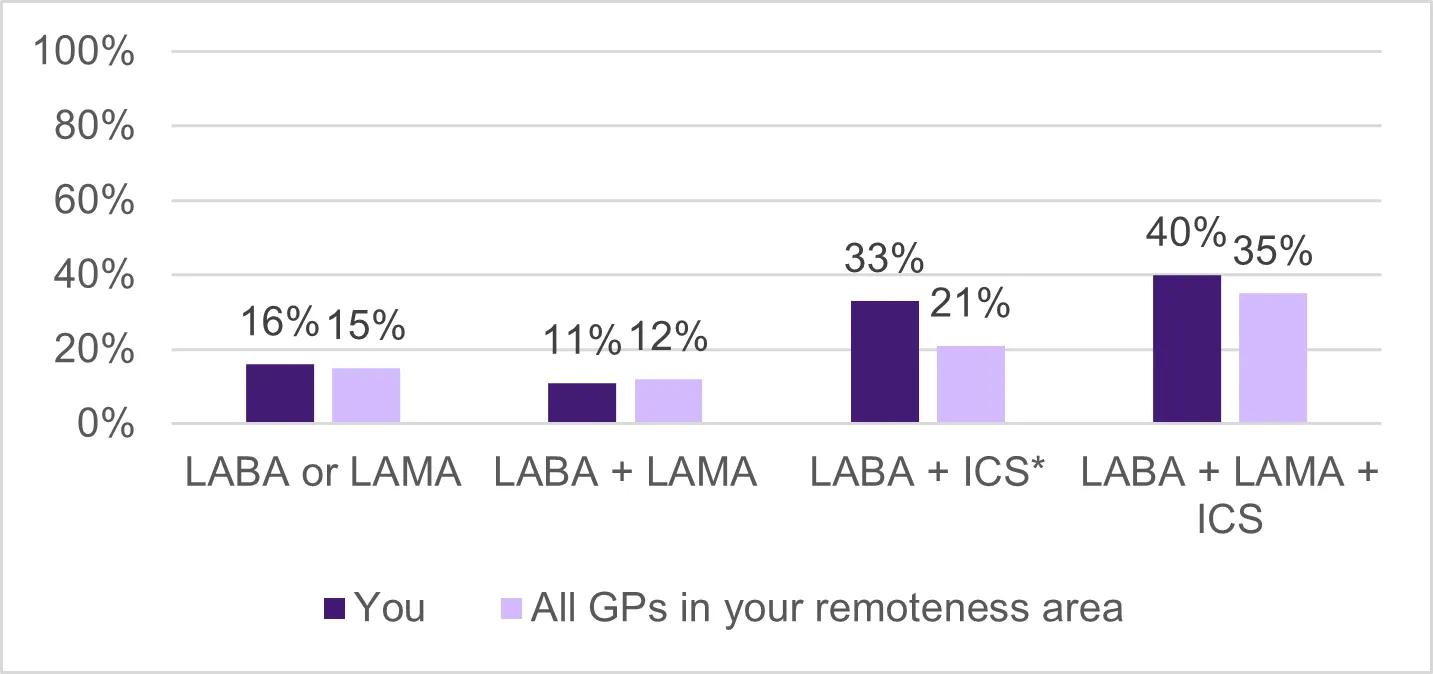
†Total percentage may be more than 100% due to rounding
Figure: Chart showing example data for percentage of patients aged 35 years and over by type of COPD treatment dispensed and were prescribed by you in 2025.
What does this figure show?
- Figure 3 shows the percentage of your COPD patients aged 35 years and over, who were dispensed COPD treatments – LABA or LAMA, LABA + LAMA, LABA + ICS and LABA + LAMA + ICS, compared with dispensing in general practitioners in the same remoteness area (RA) as you, for calendar year 2025.
- The purpose of this graph is to show you the distribution of your patients based on the COPD treatment dispensed.
My data does not look as I’d expect, why could this be?
If your prescribing of COPD treatment type is higher than you expect, this may be because you prescribed this treatment prior to the calendar year 2025, but your patients had them dispensed during the calendar year 2025.
If the proportion of a COPD treatment type is lower than you expect, this may be because your patients are not having prescriptions dispensed, or because treatment was prescribed by another clinician.
LABA+ICS is not part of the COPD stepwise management approach in patients without asthma, but some may be using this combination as a legacy treatment.
If you have any questions about data in your reports, contact Services Australia by logging into your Health Professional Online Services (HPOS) account.
Help me reflect on my data
Questions you may want to consider when reviewing your data include:
- How is your prescribing aligned to COPD stepwise management approach?
- Is there an opportunity to review your patients currently on LABA + ICS without co-existing asthma?
- Could patient understanding, multiple devices, cost, or inhaler technique be affecting adherence?
Figure 4 – Percentage of patients aged 35 years and over on triple therapy in 2025, who were previously dispensed dual long-acting bronchodilators prescribed by you§
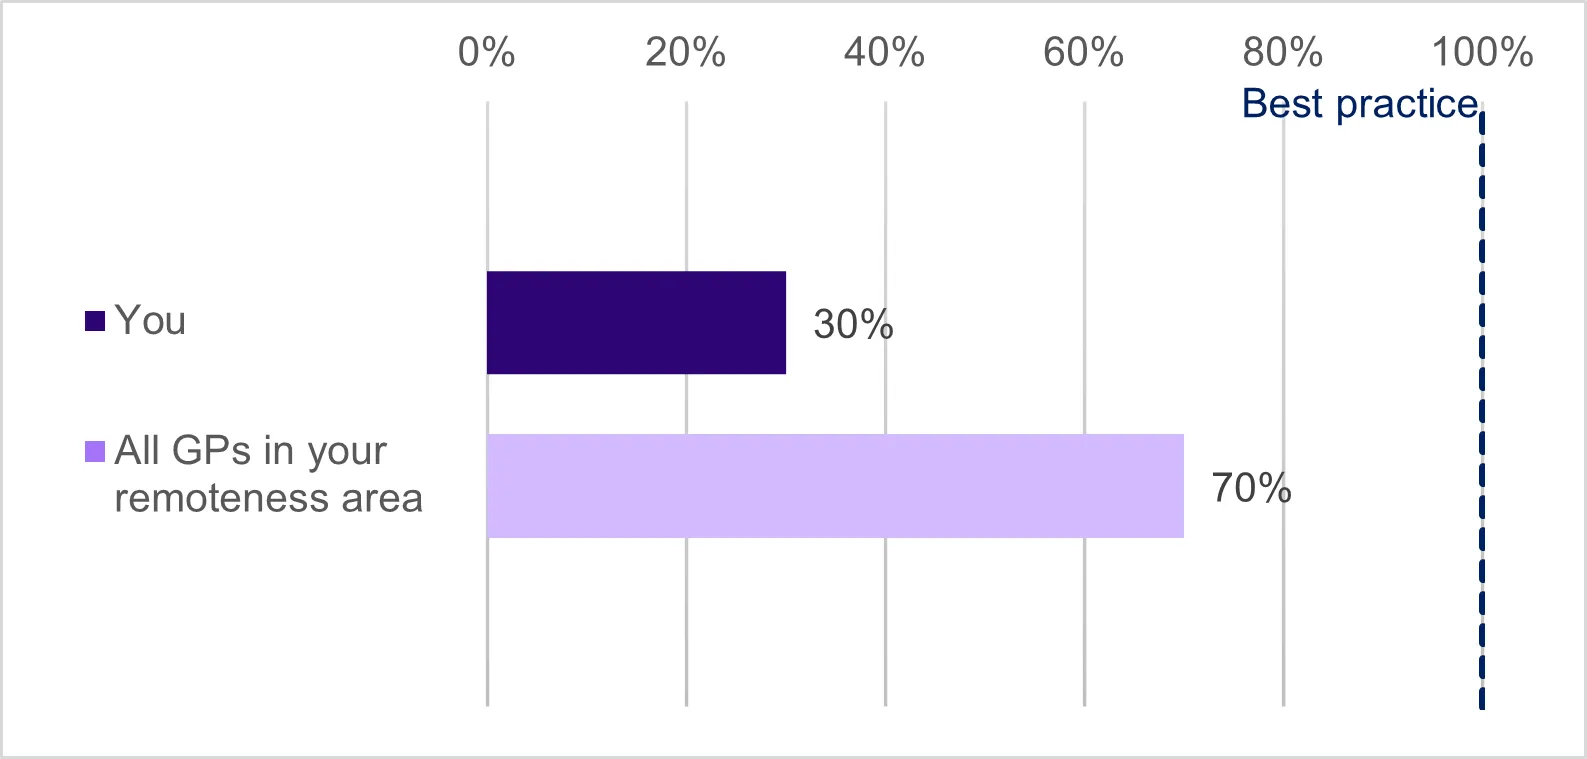
§Dispensing data coverage back to 2021 only
Figure: Chart showing example data for percentage of patients aged 35 years and over on triple therapy in 2025, who were previously dispensed dual long-acting bronchodilators prescribed by you.
What does this figure show?
- Figure 4 shows the percentage of your COPD patients dispensed a triple therapy who were previously prescribed a dual long-acting bronchodilators compared to general practitioners in the same RA as you in 2025.
- The purpose of this graph is to support reflection on whether LABA+LAMA was used before triple therapy, noting that PBS data does not show the full clinical context.
My data does not look as I’d expect, why could this be?
If your prescribing of dual long-acting bronchodilators is not as you’d expect, this may be because your patients are not having prescriptions dispensed, or other prescribers have started patients on dual or triple therapy.
If you have any questions about data in your reports, contact Services Australia by logging into your Health Professional Online Services (HPOS) account.
Help me reflect on my data
Questions you may want to consider when reviewing your data include:
- What symptoms or exacerbation history would confirm that dual long-acting bronchodilator alone is not sufficient to manage your COPD patients?
- How does your practice compare with the Stepwise approach in the COPD-X guidelines?
Your practice profile
Figure 5 – Patient age profile (number of patients) in 2025
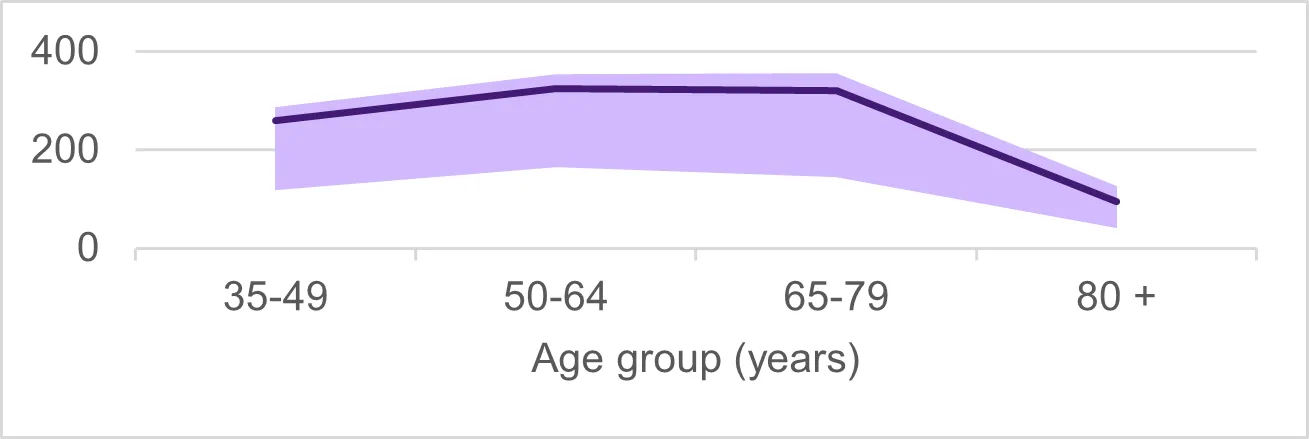
Figure: Chart showing example data of patient age profile (number of patients) in 2025.
What does this figure show?
- This graph shows the total number of unique patients aged 35 and over that you have seen for category 1 Medicare consultations between 1 January 2025 and 31 December 2025.
- The shaded area shows data for the 25th–75th percentile of general practitioners in the same RA as you.
I would like to know more
- Information for clinicians – COPD Clinical Care Standard
- Information for consumers – COPD Clinical Care Standard
- Atlas Focus Report: Chronic Obstructive Pulmonary Disease
- MedicineInsight GP Snapshot on COPD
Who do I contact for more information?
After checking the FAQs page for Practice Reflections reports, contact the Commission by email if you have further questions.